greg mcshane
Introduction
The first class was just preparation for what we will do in the rest of the semester. I won’t be using the Moodle page so much as it is not easy to update unlike GitHub. You will be learning how to use GitHub later - it’s quite easy.
Please watch the videos. You can learn a lot from them. There will not be so much reading but there will be a lot of watching. To begin with the videos will be mostly in French but some subjects are only really explained well in English.
If you want to read a book then try this one. Or here is a more elementary one.
Conway’s life on a torus
This is an amusing demonstration of how using a convolution to do something is just the right thing to do. There is a pytorch implementation somewhere.

I embedded this in a script with pygame it’s like 50 LOC.
Projects
Projects
- are due 11/1/23
- must be submitted as a Jupyter notebook
- there should be an introduction in Markdown
- there should be working code
- code should be explained in text cells using Mrakdown
- there should be a list of references
- Projects should be sent to my email mcshane@univ-grenoble-alpes.fr before 11/1/23
Battleships
It’s OK to write a programme to play this algorithmically.
- This is a good reference.
- You can even just rewrite his code using numpy.
- This is my brouillon
Friday 16/11
No class today
Friday 2/12
So we’ll discuss some project work
- like this project on [COVID](./random_walk_epidemic.ipynb
- here is a description
- and here is a video of the simulation
Here is the code for a PyGame version.
If you haven’t decided what you are doing for a project then look here
Friday 25/11
So we’ll discuss the wikipedia crawler : did you manage to fix it ?
update so I fixed my crawler to work with a cache which means it works much faster. I also dump the cache to a json file. This could make an interesting project: study how long it takes to get to some liknk in the cach as the size of the cache grows.
It was difficult to find a good working example for this week but here is the notebook
There are two kinds of regression to study:
- multi variable linear regression
- logistic regression
The example of an application of logistic regression is recognising digits. There are better ways of doing this now using CNN - maybe you can do that as a project ?
Watch at the video first:
Friday 18/11
I will be teaching at 13:45 on 19 novembre
We’ll begin by discussing how to see that everything is philosophy.
Exercise : Here is a network of pages. You should compute the eigenvalues of the adjacency matrix and try to draw the graph.
This is my solution.
Why?
Google started out as a search engine and won the search engine war by serving the most relevant results using the pagerank algorithm. Basically this
- represents the web as an adjacency matrix for a graph
- finds the biggest eigenvalue and it’s eigenvector
- interprets the eigenvector as a probability distributionr
- ranks pages according to the corresponding coefficient in the eigenvector
This is a standard thing to do for random walks on a graph.
Friday 28/10
Salle 18 pas l’amphi
- Here is my solution for Barnsley fractal
- I talked about
- my version of game of life
- how to get the code for the game of life from here using developer tools in chrome.
- here is a another notebook to look at
Why do this?
well because convolutions allow us to write complicated stuff in a very simple way sometimes.
- game of life
- simulations
- maze solving code
Friday 21/10
- Finish the notebook on affine maps
- Draw the Barnsley fern
- if you finish then here is a first notebook on convolutions_etc
well because convolutions allow us to write complicated stuff in a very simple way sometimes.
- game of life
- simulations
- maze solving code
Friday 14/10
Here is a notebook with solutions to last week’s exercises.
We were talking about Newton fractals, these are very pretty. This is how to do it properly using numpy.
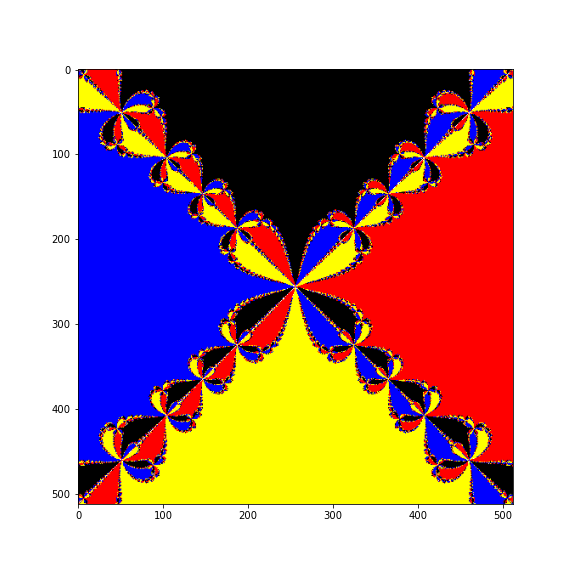
I uploaded a video to YouTube as that was easiest
This is the notebook to study for this week.
If you really want to do a project on games then look at this
Friday 7/10
This week we’ll do some more graphics and draw some fractals.
- Cantor’s staircase
- Barnsley’s Fern
- Koch snowflake
We’ll be using a lot of recursion to build tree structures.
Here is the notebook to study.
Friday 30/9
This is the correction for last week.
And this is the notebook to study for this week.
Watch this video about Matplotlib first.
Why are we doing this ?
Everybody needs to make graphs and figures for
- reports
- books
- web pages
Friday 23/9
Here is the second notebook.
– There are some difficult things in it mainly about matrices. – There are some exercises at the end of the worksheet.
Watch these videos before starting:
Why do this?
Numpy was developed by physicists for doing large numerical calculations. It is efficient because the loops that we would usually write are hidden by the API and done in C.
It was adapted for doing Data Science and there is a special module for this Pandas.
A few years ago Google published an API to their neural net framework called TensorFlow. The data is fed to the algorithms in numpy arrays.
Finally, as you will see in the notebook, images are stored as matrices and elementary image processing can be done using linear algebra and slicing.
Friday 16/9
Here is the first notebook I’ve prepared - you should go through it once you have installed JuPyTer (see below it comes with Anaconda).
If you are not familiar with Python then try this notebook first.
At the end of the first notebook there is some code to analyse letter frequency in Hamlet. You should go through it then do the exercise:
Exo
Find another text and analyse it
Why do this?
Machine translation has made big progress in recent years read this because of statistical language models.
For BERT: you can try and install it but you will need a pretty good computer.
We are only going to do very basic statistics on words but the Python code is close to what really happens.
- Texts get split up into words
- frequencies of pairs of words are calculated.
This is done for text scraped from:
- wikipedia
- novels and newspaper articles
- forums
Installing Anaconda
We will be using Anaconda because it is convenient and it is really industry standard for doing DataScience. It comes with JuPyTer, Numpy, Matplotlib, Pandas.
You can follow the instructions on this page to install Anaconda on your machine.
Google Colab
If Anaconda installation doesn’t work then sign up for an account to Google Colab. To use this service you will have to be connected to the internet all the time.
It is a good idea to sign up for this now because Colab is configured for using GPUs and works well with Deep Learning packages ie Keras/Tensorflow.
Kaggle
I have a Kaggle account too but I rarely use it. In theory you can follow the course using a Kaggle account if you have one.
Getting started
- is a web-based interactive development environment for Jupyter notebooks, code, and data.
- is flexible: configure and arrange the user interface to support a wide range of workflows in data science, scientific computing, and machine learning.
- is a javascript front end running in my browser that interfaces with different kernels.
Lab is a version of JuPyteR scheduled to replace jupyter notebooks
but there are still some bugs (in particular when using interactive widgets).
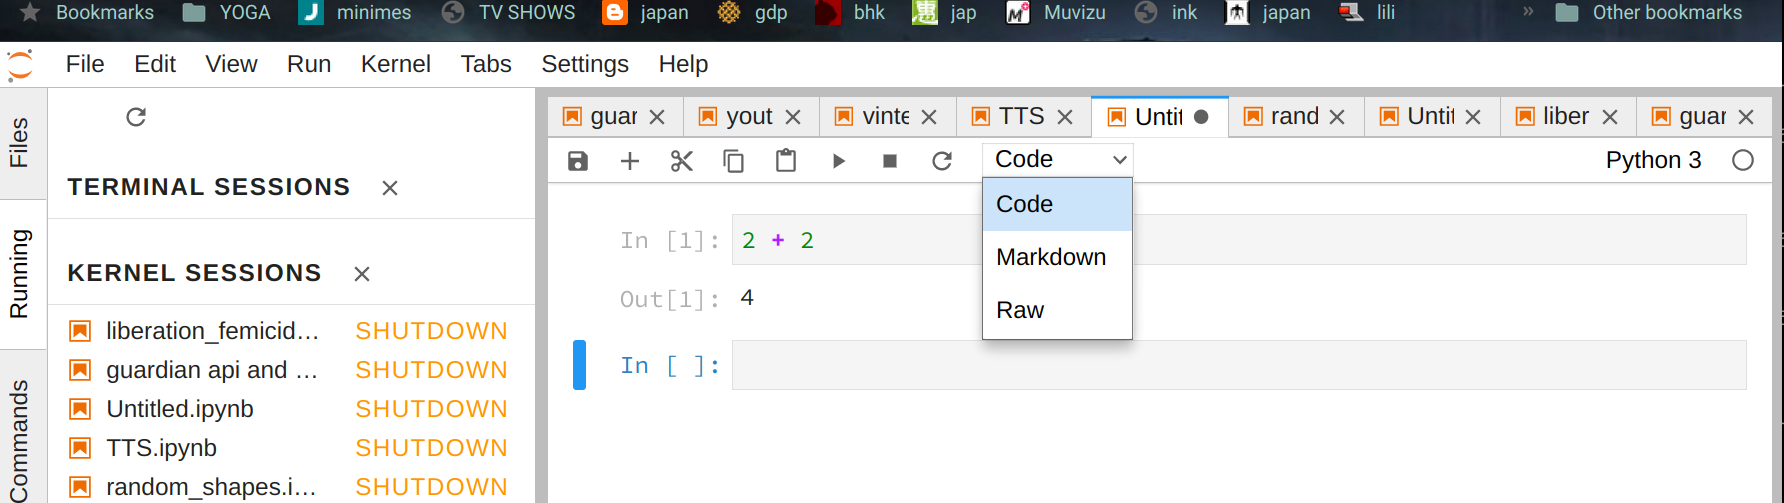
When I run jupyter lab this appears in the navigator:
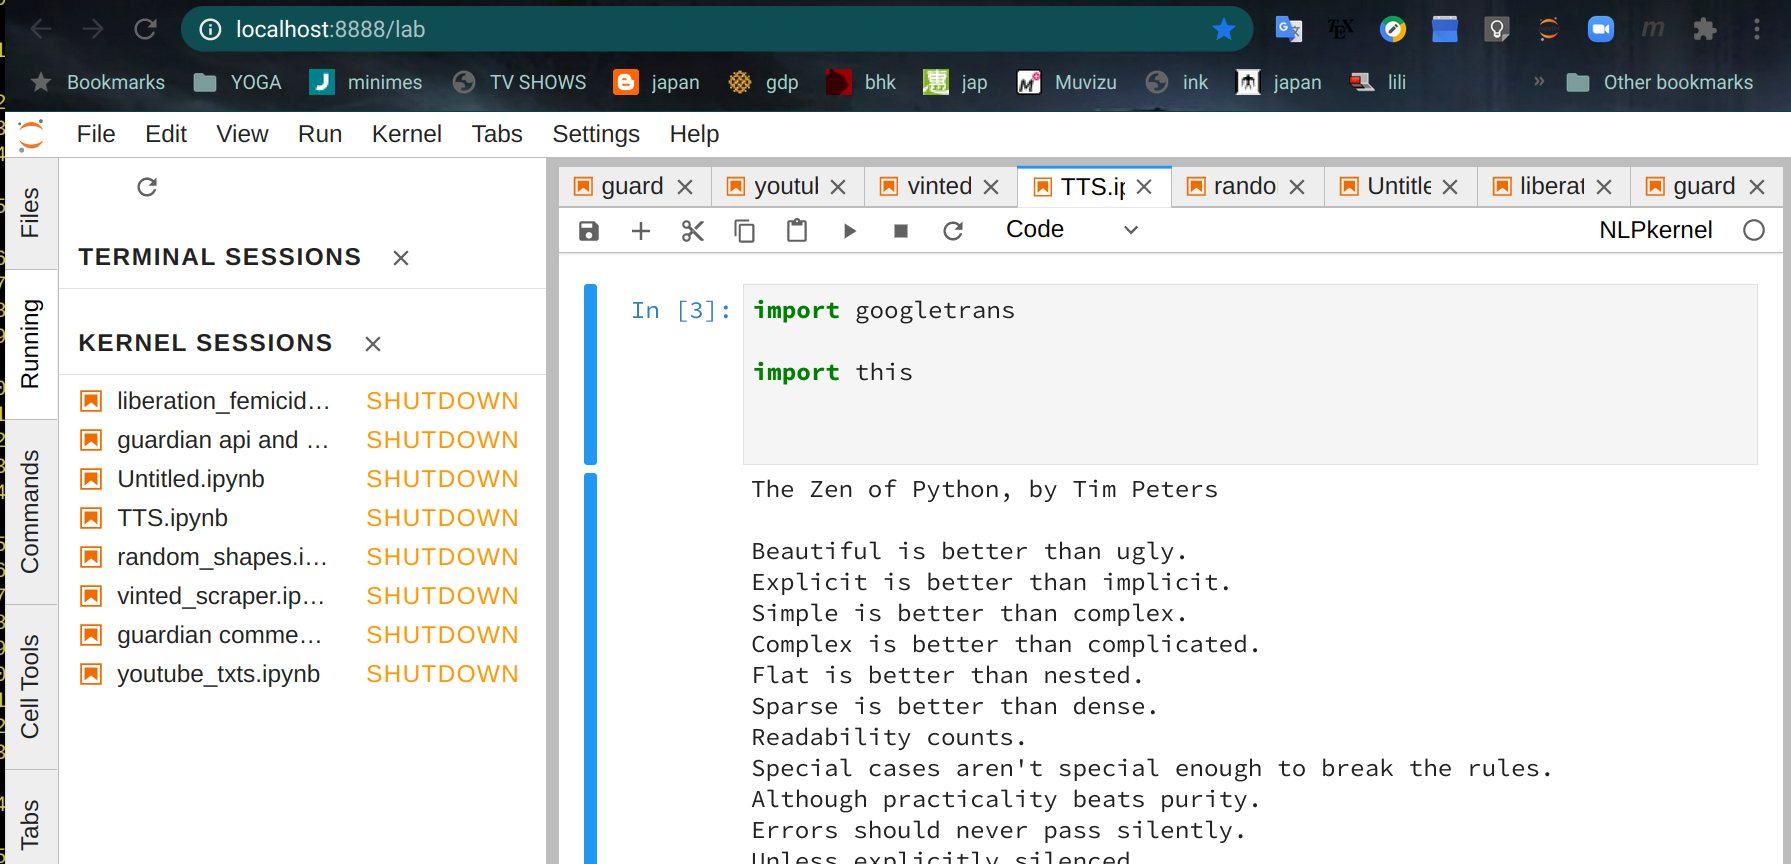
The kernel sessions list on the left are recent projects that are automatically opened. On the right there is a window with an open project TTS.ipynb. The file format ipynb stands for Iron Python Notebook. If you know about these things then it is really a json file.
You can open a new notebook from the File menu.
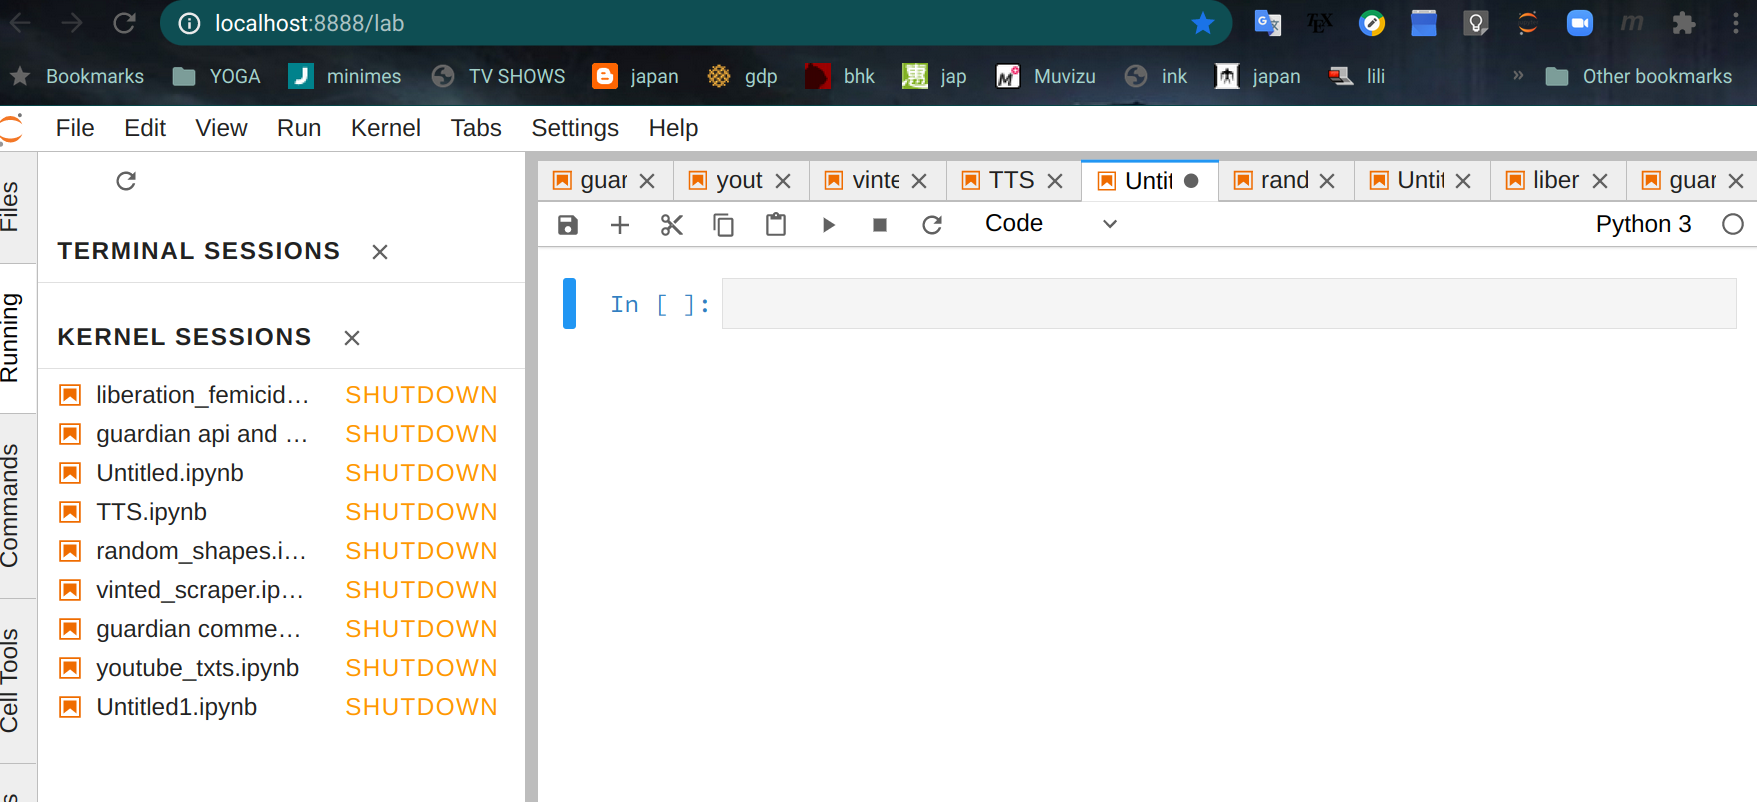
The blank rectangle is a code cell
- you can write python code here and execute it with
shift-enter.
There are 2 other kinds of cell
- Markdown for formatted text and math formulas.
- Raw
You can change the cell type from the menu:
Notebooks
You should read this tutorial for biomaths to get an idea of how notebooks work.
Lots of people use notebooks for swapping and explaining results :
Further reading
Why use Python?
Because even the authors of the C language manual say so:
Python Idioms
Watch the first part about collections and functions.
Here are the
slides in english. The code is Python 2 - so if you want it to work remember that in Python 3 print is a function!
Markdown
Read about Markdown in english and in french.